Make team workload visible, as a living 3D city
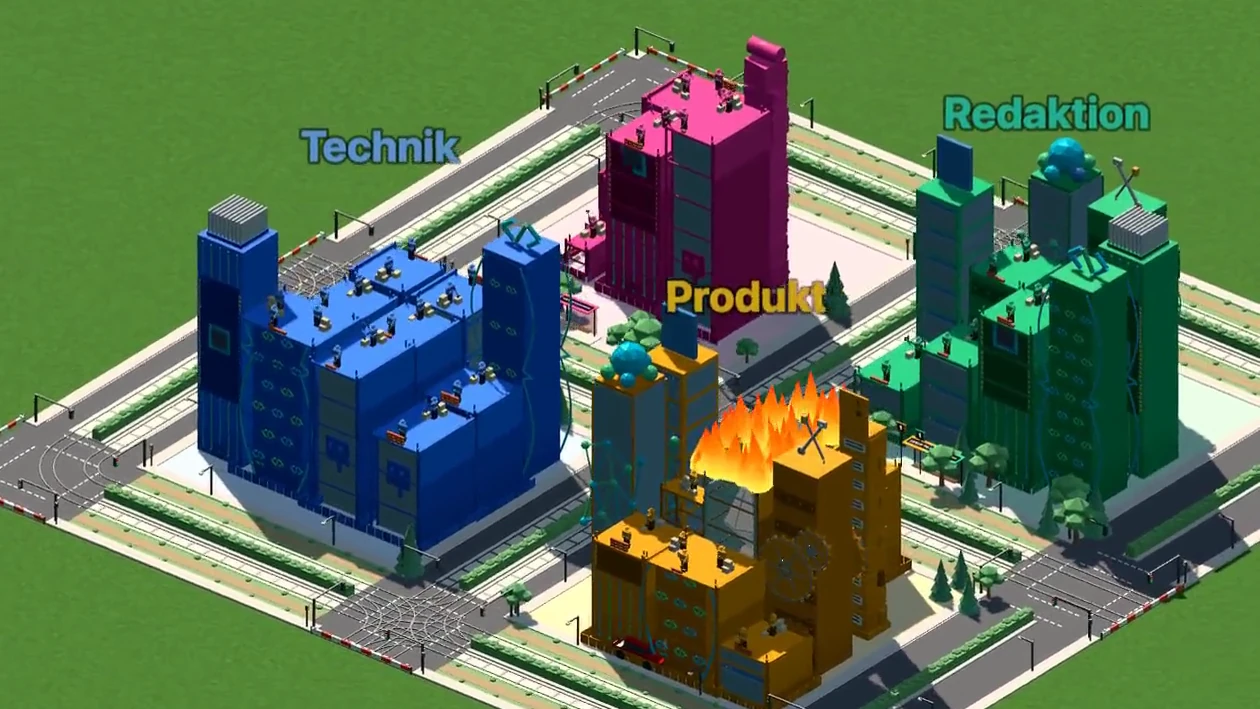
People who carry too much in a team rarely say so out loud. It gets lost in task lists, and in meetings it only shows once something has already been left undone. KlangCity wants to make team workload visible before it gets that far: your work appears as a 3D city, and the city shows where things are on fire.
The problem: you can’t see overload in a list
A Kanban board shows what needs doing. It doesn’t show where work piles up. Whether one person has had nothing but urgent tasks for two weeks, whether a project is slowly falling behind or whether nobody has touched a task for a month: it is all in the data. But to see it, you would have to filter, count and compare. Nobody does that in everyday work.
KlangCity does the maths for you and turns it into a picture. You open the city and see in a few seconds what you would spend a long time looking for on the board.
How visual project management with the city works
The city is not decoration. It is a visual language. Every element stands for something real:
- Every task is a building. The construction stage follows the work phase on the board, the height the number of expertise groups involved. There are 45 building types in 9 families.
- Every team is a district with its own colour.
- Every project is a tram line, and milestones are its stops.
- Pedestrians walk to the tasks someone is looking at right now.
Day and night, traffic and a soundscape come on top. The city grows live while the team works on the board, in chat and in meetings.
Spotting overload in a team: 35 signals, calculated live
KlangCity calculates 35 signals from your work data. When one is triggered, something happens in the city. The signals are created without AI, using fixed rules and numbers you can check. A selection:
| Signal | What you see | Trigger |
|---|---|---|
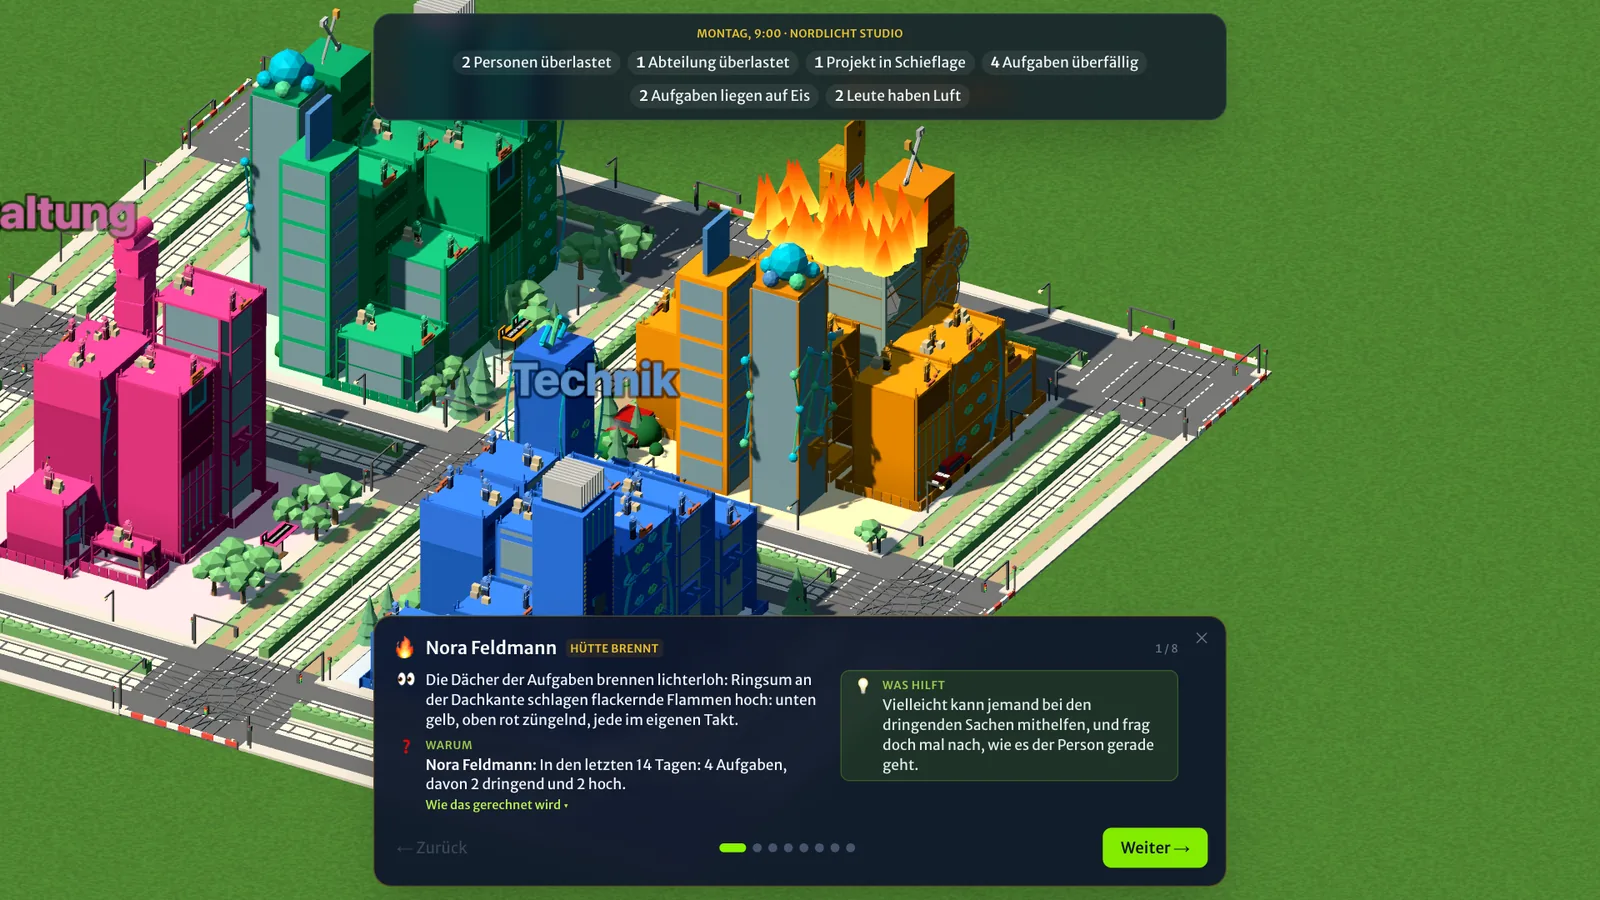
| “House on fire” | A person’s house is on fire | At least 3 tasks in 14 days, all urgent or high priority |
| “Overloaded” | Thick smoke above the house | Open workload weighted by priority is more than 3 times the average of their colleagues |
| “Free capacity” | A party with a disco ball outside the house | Fewer than 2 open tasks |
| “Project in trouble” | The project tram is on fire and passengers are jumping off | More than 50% of open tasks are overdue |
| “Task overdue” | The building sinks into the ground | More than 7 days past the due date |
| “Task on ice” | A layer of ice and icicles | Not moved for more than 30 days |
| “Expertise group overloaded” | Pickets in the district | More than 8 workload points per person |
| “Going really well” | Golden evening light over the city | More than 70% of started tasks are close to the finish or done |
KlangCity weights the workload by priority: urgent counts 4 points, high 2, medium 1, low 0.5. So a person with five urgent tasks weighs more than one with five small ones.
Other signals report, for example, a “Bottleneck person” on whom a lot of collaboration depends, someone who “Works at the last minute”, a group where “Nothing gets finished” or a project with no milestone (“No goal set”). Klangi, the cat who guides you through the app, explains every signal in the city glossary: what you see, why it happens and what can help. How to read warning signs like these in everyday work is covered in the guide: spotting overload in a team (German).
Example organisation, no sign-up. Works on your phone too.
Numbers instead of gut feeling
A burning house on its own doesn’t say much. That is why Klangi gives you the numbers behind it, for example: “In the last 14 days: 4 tasks, all urgent.” Or: “4 of 7 open tasks are overdue.” So you see not only that something is going on, but also how much. That makes conversations easier, because you are talking about the same facts.
The health of the city and the city replay
City health brings all active signals together in one ring, split into House on fire, Standstill, Chaos, Drifting, Going it alone and Harmony, with the trend over the last two weeks. Every Monday a weekly report sums up the week.
The city replay plays back in time-lapse what has changed: since the last replay, over 7 days or over 30 days. In Basic the replay goes back 7 days, from Pro 30 days. It works for the whole city or for a single building. Handy after a holiday, when you want to know what happened while you were away.
Make it visible, without surveillance
Signals about individual people are a sensitive topic. That is why the owner of your organisation decides who sees them: all members, the person themselves together with owners and admins, the person themselves with numbers per group for leads, only the person themselves or nobody. Guests never see them.
On top of that, everyone chooses their own view: “My tasks”, “My circle” or “Whole organisation”. If you want to focus on your own work, you narrow the signals down to it. The city is there to help share out work fairly, not to control people. More on this in the guide: sharing out workload fairly (German).
To be honest: the city needs a little time
Many signals look back over 14 or 30 days. A new city is therefore still quiet in its first week. After about two weeks of real work, it shows what it can do. If you want to see what that looks like before then, take a look at the demo city “Nordlicht Studio”: there are fires in several places, and a short guided tour explains every signal.
The city works hand in hand with the Kanban board: every card there is a building here. Plans and what they include are on the pricing page. All 35 signals are included in every plan, including the free one.
Example organisation, no sign-up. Works on your phone too.
Frequently asked questions
Does KlangCity need AI to spot overload?
No. All 35 signals are calculated from your work data using fixed rules, without any AI. The AI only helps with explanations and falls back to rule-based texts when it is not available.
Which data does the city use?
Ordinary work data: who is working on what, how urgent it is, by when and how often you comment on tasks or message each other directly. There is no mood questionnaire and no survey.
Who sees whether I am overloaded?
The owner of your organisation decides, in five levels: all members, person and leads, the person with numbers per group for leads, only the person or off. Guests never see signals about people.
Does the 3D city run on a phone too?
Yes. For iPhone there is KlangCity on the App Store, for Android on Google Play, and in the browser the web app runs on any phone, the 3D city included.
When does my own city start showing signals?
After about two weeks of real work, because many signals look at the last 14 or 30 days. Until then you can try everything out in the demo city.